
When you hit “send” on a text message, it is easy to imagine that the note will travel directly from your phone to your friend's. In fact, it typically goes on a long journey through a cellular network or the Internet, both of which rely on centralized infrastructure that can be damaged by natural disasters or shut down by repressive governments. For fear of state surveillance or interference, tech-savvy protesters in Hong Kong avoided the Internet by using software such as FireChat and Bridgefy to send messages directly between nearby phones.
These apps let a missive hop silently from one phone to the next, eventually connecting the sender to the receiver—the only users capable of viewing the message. The collections of linked phones, known as mesh networks or mobile ad hoc networks, enable a flexible and decentralized mode of communication. But for any two phones to communicate, they need to be linked via a chain of other phones. How many people scattered throughout Hong Kong need to be connected via the same mesh network before we can be confident that crosstown communication is possible?
A branch of mathematics called percolation theory offers a surprising answer: just a few people can make all the difference. As users join a new network, isolated pockets of connected phones slowly emerge. But full east-to-west or north-to-south communication appears all of a sudden as the density of users passes a critical and sharp threshold. Scientists describe such a rapid change in a network's connectivity as a phase transition—the same concept used to explain abrupt changes in the state of a material such as the melting of ice or the boiling of water.
Percolation theory examines the consequences of randomly creating or removing links in such networks, which mathematicians conceive of as a collection of nodes (represented by points) linked by “edges” (lines). Each node represents an object such as a phone or a person, and the edges represent a specific relation between two of them. The fundamental insight of percolation theory, which dates back to the 1950s, is that as the number of links in a network gradually increases, a global cluster of connected nodes will suddenly emerge.
The question that scientists struggle to answer is: When? What is the equivalent, for any given network, of the zero degrees Celsius at which ice melts or the 100 degrees C at which water boils? At what point does a meme go viral, a product dominate a market, an earthquake begin, a network of cell phones achieve full connectivity or a disease become a pandemic? Percolation theory provides insight into all these transitions.
Mathematicians typically study idealized networks—symmetric in geometry and infinite in extent—because they are the ones amenable to theoretical calculations. Infinite networks are generally the only ones with truly sharp phase transitions. Real-world networks are limited in extent, are often messy and require challenging calculations—but they, too, have transitions, albeit more rounded ones. As the world becomes increasingly connected through complex layers of links that transport people, provide them with energy by means of electrical grids or connect them via social media—and sometimes spread disease among them—percolation theory becomes ever more pertinent.
Snapping into Place
In 1957 British mathematicians Simon Ralph Broadbent and John Michael Hammersley first framed percolation theory as a purely mathematical problem. They abstracted the study of percolation in chemistry, which describes a fluid filtering through a material, such as oil seeping through porous rock or water filtering through ground coffee. The percolation network of a rock layer consists of little holes in its structure, represented as nodes, along with the channels or cracks that allow fluid to flow between them, represented as edges. Unsurprisingly, oil flows farther through rock that is more fractured. Using percolation theory, Broadbent and Hammersley predicted that in an idealized rock, the oil will switch from flowing through only small regions to suddenly permeating almost the entire rock when the density of cracks passes a certain threshold.
Geologists use a version of percolation theory to study the sizes of clusters in fractured rock, which is relevant to the extraction of oil by fracking and to the occurrence of earthquakes. To model earthquakes, seismologists create percolation networks that match the scale and density of observed cracks, and then they account for stresses by adjusting the probability of cracks connecting up. As stresses and links increase, clusters expand until, suddenly and unpredictably, a quake breaks out. Modified versions of the percolation process allow cracks to heal and refracture to simulate aftershocks or long-term change.
Percolation theory also illuminates physical and chemical processes on a much smaller scale, such as polymerization, the process by which small, simple molecules called monomers bind together to form larger clusters called polymers. In the percolation-theory framework, each monomer acts as a node, and two neighbors may spontaneously form a bond, or edge. If the likelihood of their joining increases, the system will eventually hit the percolation threshold, and one giant, connected polymer will emerge. This process is what causes powdered gelatin dissolved in water to set and form Jell-O.
The networks in fractured rock or linked polymers are extremely intricate. It would be nearly impossible to describe their structure precisely, but Broadbent and Hammersley showed that they can be approximated by repeating patterns that are amenable to analysis. The simplest example is a square lattice, which looks like an endless sheet of graph paper: the nodes are arranged in a grid and are connected by four edges to their neighbors.
To see how a fluid might travel through this lattice, imagine that each tiny edge on the graph paper is a pipe that is either open or closed. We can determine the state of each pipe by tossing a coin labeled “open” on one side and “closed” on the other. The resulting landscape of open and closed pipes will be a random network, and it will have some “open” clusters in which all the nodes are connected by a series of open pipes. If you poured water into any node in such a cluster, it would flow through the open pipes to reach all the other nodes in that cluster.
Percolation theory is concerned with the connectivity of the network, which corresponds to how large the open clusters are. But “large” is an ambiguous concept that does not easily lend itself to the formalities of mathematics. So mathematicians often substitute large numbers with infinity. The central question then becomes: Is there an infinite cluster? “For us, it's much easier to answer this yes-or-no question than to answer how many big clusters do we see of this or this size,” says Benedikt Jahnel, a mathematician at the Weierstrass Institute for Applied Analysis and Stochastics in Berlin.
In fact, the likelihood of an infinite network having an infinite cluster is always either 0 or 100 percent. That is because the process of percolation is subject to a general principle in probability theory called the zero-one law, discovered by Russian mathematician Andrey Kolmogorov in the 1930s. Suppose you flip a coin an infinite number of times. The zero-one law pertains to any questions about the outcome for which the answer does not depend on any finite number of flips. (For example, the answer to the question, “Did you land on heads infinitely many times?” will not change if you alter a finite number of coin flips, but the answer to the question, “Did you land on heads on the third toss?” can be changed by altering just one coin flip.)
The zero-one law tells us that finite changes cannot disturb phenomena that are infinite in nature. So the probability of finding an infinite cluster in an infinite network cannot change slightly, such as from 0.81 to 0.82; it must take one of the extreme positions—zero or one. To put it another way, an infinite network will either have no infinite cluster (a probability of zero for finding an infinite cluster) or have an infinite cluster (a probability of one).
Thus, switching a finite number of open pipes to closed pipes, or vice versa, does not have any effect on whether an infinite open cluster exists. The probability of finding an infinite cluster is either zero or one. Which is it?
Finding the Threshold
The answer depends on the bias of your coin. Imagine you have a dial that controls the bias. When the dial is turned all the way to the left, the coin will always land on “closed.” Once all the pipes are closed, water poured into a node will not flow anywhere, and the probability of finding an infinite cluster will be zero. As you turn the dial clockwise, the probability that the coin will land on “open” increases, and with additional flips there will be more and more open pipes. When the dial is turned all the way to the right, the coin will always land on “open,” and eventually the water poured into one node will flow everywhere else. The probability of finding an infinite cluster is then one.
If you slowly turn the dial clockwise, the likelihood of pipes being open gradually increases, and it might seem like the chance of finding an infinite cluster should also increase gradually from zero to one. In fact, the change happens instantly because of the zero-one law: it states that the likelihood cannot be somewhere between zero and one. For the square lattice, the probability snaps from zero to one when the dial is exactly in the middle—when the coin has no bias. This critical position of the dial is known as the percolation threshold. No matter what the shape of the network—whether, for example, it is a triangular lattice or a three-dimensional version of the square lattice—the essential question of percolation theory remains the same: Where is the threshold? How biased does the coin need to be before enough links are open to guarantee an infinite open cluster?
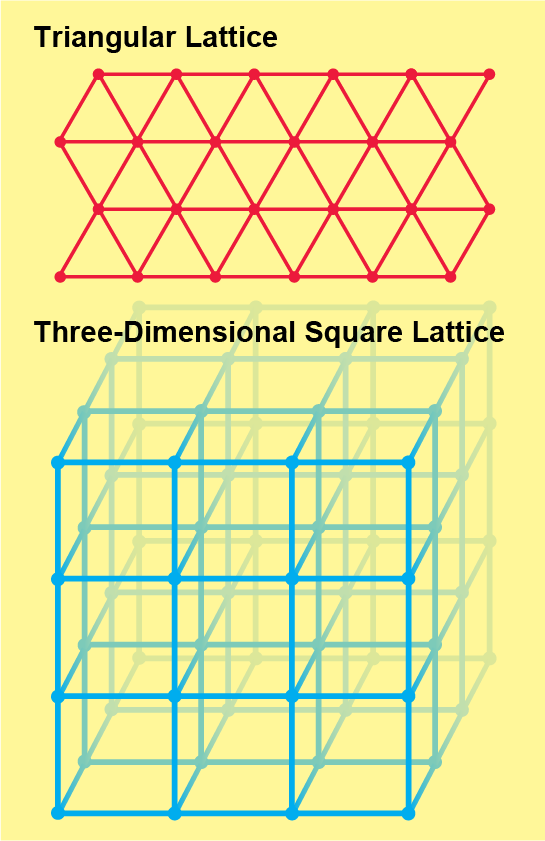
The answer depends on the exact shape of the (infinite) network and is far from easy to find. Even proving that the threshold for a square lattice—the simplest system—is one half was a daunting challenge, finally solved by mathematician Harry Kesten in 1980. And despite decades of effort, the exact percolation thresholds are known only for a few exceedingly simple networks. “There's a whole bunch of work done on just finding what the threshold is,” says Robert M. Ziff, a statistical physicist at the University of Michigan. “It's mind-boggling how many different systems people have looked at.” Ziff put together a Wikipedia page documenting the percolation thresholds for hundreds of different networks. The bias for the triangular lattice is roughly 0.347, a number determined analytically, but the vast majority of the numbers on that page (including the threshold bias of a three-dimensional square lattice) are approximations derived through computer simulations.
Mesh Networks
Lattices are good models for percolation in physical systems such as fractured rock, where the holes are in fixed locations and the cracks between them form randomly. But other real-world networks are far more complicated. In the FireChat and Bridgefy mesh networks mentioned earlier, for example, the locations of the nodes—the phones carried by the Hong Kong protesters—changed constantly. The edges in such a network, or connections, form when two phones are near enough to each other—within the tens-of-meters range of the Bluetooth-based apps used to share messages. Such networks are described by a different model, called continuum percolation, because the nodes of the mesh network can be anywhere in a continuous space.
Like any mathematical model, the abstract version of this network is based on simplified assumptions. The smartphones are randomly scattered, without any mimicking of the natural clusters and patterns in a map of people's meanderings, and two smartphones are linked based only on their distance from each other, without any consideration of walls or other interference. The model nonetheless highlights the central role that percolation theory plays in real mesh networks.
There are two ways to increase the connectivity of this continuum percolation network: enable direct connection at a longer range or add more smartphones, increasing the density of users. These modifications can be thought of as dials like those described for the pipe network; turning either one clockwise will increase connectivity. And in these models, “there's a switch where you really go from local to global connectivity,” Jahnel says.
For designers of mesh-networking apps, finding the percolation threshold is a practical engineering problem. Changing the device's power, which controls the range, is one way to turn a dial. The central question, says Ram Ramanathan, chief scientist for the mesh-networking company goTenna, is, “What do you want the transmit power to be to have a connected network?” The answer would be fairly simple if power and connectivity had a linear relation—if each small increase in power led to a proportional small increase in connectivity. But the existence of a percolation threshold means there is a risk that the network will suddenly lose connectivity as people move around. The optimal power is one that ensures the network is always connected but does not waste energy.
The other dial is the density of phones. Mesh networks with a fixed range need a critical density of users and are most likely to provide widespread connectivity at crowded events such as a music festival, a soccer game or a large protest. Jorge Rios, Bridgefy's CEO and co-founder, says that the company saw large spikes of new users in Kashmir, Nigeria, Hong Kong and Iran during periods of civil unrest, when people turned to mesh networks to maintain communications in case the government shut down the Internet or large crowds jammed cellular connections. Some neighborhoods, such as Red Hook in Brooklyn, N.Y., are using mesh networks to expand Internet access by fixing permanent nodes to the tops of buildings. Much of the necessary hardware and routing technology is still evolving, but it is easy to imagine bold, futuristic applications—autonomous vehicles could communicate directly, for example, sharing information about traffic patterns or road hazards without relying on any extra infrastructure.
Disease Contact Networks
The networks used to model the flow of oil through rocks or direct communication between phones mimic the real spatial structure of these systems: two nodes are connected by an edge if the objects they represent are close to each other in physical space. But for networks that track the spread of disease from person to person, the links are determined by the ways in which that specific germ is transmitted among them. Such networks are particularly tangled: one infected person spending an hour in a nightclub in a big city may pass a virus to a person who carries it across the country or even across continents in the following days.
The simplest epidemiological models lump everyone into three buckets—susceptible, infected and recovered—and neglect this complex structure of connections. In such models, infected people pass the disease to random others in the susceptible bucket under the assumption that everyone in that group—students in a dorm or residents in a city—is equally likely to get it. The rate at which susceptible people get infected depends on the basic reproductive number, the average number of new infections caused by a single infected person, abbreviated as R0. If R0 is greater than one, then the virus is spreading, and if it is less than one, then the outbreak is dying out.
In practice, however, how people interact with one another influences the overall spread of the disease. For example, a 2003 outbreak of severe acute respiratory syndrome, or SARS, initially had R0 values between 2.2 and 3.6, but case counts were “much lower than expected during this period, as suggested by a simple calculation,” wrote Lauren Ancel Meyers, now director of the University of Texas COVID-19 Modeling Consortium, in a 2006 article. The discrepancy, she argued, followed from the assumption that “all susceptible individuals are equally likely to become infected,” which ignores the complex shape of people's contact networks. In particular, the estimated R0 values for SARS were based on its rapid spread within apartment buildings and hospitals, which have “anomalously high rates of close contacts among individuals” compared with the general population. But because people infected with SARS became very sick rather quickly, they ended up in hospitals before they could infect many people outside of them.
The edges in a disease network express specific relations. In one showing the potential spread of HIV, for example, two people are connected by an edge if they have exchanged bodily fluids. A network showing the potential spread of COVID-19 has a very different structure of edges, representing close contact without respiratory protection. Lockdowns or restrictions such as closing businesses and limiting travel alter this edge structure and, along with masks and physical distancing, prevent the virus from leaping from one person, or node, to another. One challenge for epidemiologists is to find ways to sufficiently disconnect the network.
Real-world disease contact networks such as those that show the spread of COVID-19 are extremely complicated and difficult to describe precisely. Even if the exact structure of the network were known, it would be challenging to analyze mathematically. Computer simulations and massive data analysis are used to predict future case numbers, evaluate the impact of one meter versus two meters of social distancing, and quantify the significance of schools and restaurants in the spread of the coronavirus. Alessandro Vespignani, a complex-network theorist at Northeastern University, refers to this research as his “wartime” work—tactical and occasionally messy but producing the immediate, numerical results that policy makers and health-care workers need. Vespignani and his colleagues create “a kind of synthetic society where all these individuals are packaged into a computer” to run simulations, he says.
In contrast, Vespignani refers to his “peacetime” research as the period when “you develop the model, you calibrate different ways of modeling things, you develop specific approaches, you look up how you can improve on your results.” To obtain a theoretical understanding of how the basic shape and structural features of a network impact the spread of a disease, scientists turn to percolation theory.
The tools offered by the traditional pen-and-paper mathematics of percolation work only in the simplest cases, where the network is artificially ordered and symmetrical. Even so, “the mathematics is crucial to guide your understanding,” Vespignani says. Network epidemiologists strip the network down to its essentials, in particular, its so-called degree distribution. A degree is the number of other nodes that a specific node is connected to. In the square lattice, for example, all nodes have degree four. In a disease network, however, the degree varies dramatically: some individuals have many contacts and may potentially spread the disease to many people, whereas others are fairly isolated.
The degree distribution describes how likely a node is to have each degree. In disease contact networks, this translates to how likely someone is to infect (or potentially be infected by) a certain number of other people. To understand how this aspect affects the percolation threshold, mathematical epidemiologists such as Meyers generate thousands of sample networks that are essentially random except for one feature: they all have the same degree distribution. This approach is a way of isolating the degree distribution to perceive its role in the network's structure. If the properties of the generated networks match up with the real-world networks, then the degree distribution or any other features that are “baked into the math” are likely to be relevant to the spread of the disease, Meyers says. If the match is perfect, “then your mathematical results would look just like your simulations.”
Research shows that the percolation threshold for a network drops if the network has a broader degree distribution, meaning a wider range in the degrees of the nodes. So a disease will spread more easily in a network with some highly connected people and some isolated individuals than in a network where everyone has roughly the same number of contacts. Joel Miller, a mathematical epidemiologist at La Trobe University in Melbourne, Australia, explains the observation heuristically: “If I have 10 times as many contacts as you, I'm 10 times as likely to get infected, and I'm 10 times as likely to spread as you, so that's 100 times more important for disease spread.”
Networks of the Future
Percolation theory is used to model other “contagion” phenomena, such as when a meme on a social media network slowly gains traction before suddenly going viral. It can be applied to economic models to show how a particular product can quickly come to dominate a market as people share recommendations among their social contacts. Voter models, where people influence their community, also show threshold effects.
In contrast to the infinite, neatly ordered networks that mathematicians have traditionally studied, networks derived from real examples are finite in extent and messy. Finite networks do not instantly jump from being connected within small pockets to being connected almost everywhere the way infinite networks do, but they do usually make the switch very quickly. To understand these processes, network theorists go back and forth between the mathematics and the computer simulations. The simpler networks guide them in building detailed computer models of actual networks, lessons from which in turn influence how they modify the pen-and-paper models to gain insight into the real world.
Many important network models of the spread of COVID-19 integrate information from other networks. School systems, train routes and hospital-employee schedules all form networks—and each of them influences the course of the pandemic. “We live in this system of interdependent networks, and we can't just think about one without understanding the consequences that the others bring,” says Raissa D'Souza, a complex-network theorist at the University of California, Davis. Each network is its own complex system with its own emergent behavior. Increasingly, we are coupling these networks to create an even more complex system. But there is no clear theoretical framework to study such networks of networks. Understanding how their properties are affected by the properties of the constituent networks is a challenge for the future.
“We are not living in a bubble or a fully mixed world. We live in a world with contacts, we follow Twitter accounts, and these are places where percolation and other models enter,” Vespignani says. Gaining a better understanding of those theoretical mathematical models now “can make the difference in the future.” Percolation networks are easily adaptable, yielding new playgrounds for mathematicians and practical applications for scientists, but these diverse models are unified by one surprising feature: they all have a sharp pivot point where just a few new connections tie the network together. As the world becomes ever more connected, the necessity of understanding these crucial transitions becomes ever more urgent.
 Rights & Permissions