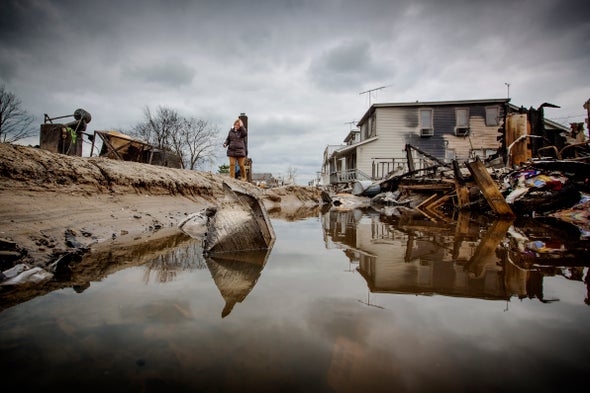
Superstorm Sandy’s 2012 surge swamped lower Manhattan, unmoored a Jersey Shore roller coaster and pushed the toxic waters of Brooklyn’s Gowanus Canal into nearby basements. All told, the storm’s floodwaters did more than $60 billion in property damage in New York State, New Jersey and Connecticut. Although scientists have long known global warming is exacerbating such events by raising sea levels, a recent study calculated just how much of Sandy’s bill can be charged to climate change: about $8 billion.
The study’s new modeling method can be used to determine how much climate change adds to the cost of any coastal storm or other flooding event—past or present. “It’s putting the climate change price sticker on the event where it hasn’t been visible,” says the new study’s lead author Benjamin Strauss, CEO and chief scientist of Climate Central, a nonprofit research and news organization.
Such research is part of a growing field called attribution science, which uses observations and models to compare our current world with a hypothetical one where climate change has not been happening. This comparison shows how rising temperatures have affected the likelihood and severity of a variety of extreme weather events, from heat waves to floods. Attribution science reveals how climate change is loading the dice, increasing the odds that events will overwhelm our capacity to cope and turn into severe disasters. The new study takes the science a step further, providing a more concrete sense of how much of the damage from such disasters is because of the changing climate—and the price associated with it.
Strauss and his co-authors calculated how much local sea-level rise is linked to an increase in temperature (that is, how much of that rise results from melting polar ice caps and the expansion of the ocean as it absorbs most of the excess heat trapped by greenhouse gases). In the New York City area, warming has caused about four inches of sea-level rise over the past century—about half of the local rise over that time period. The team then used computer models to relate various sea levels to flood damage. Sandy’s damage was almost entirely from flooding, which let the researchers translate those results to estimates of how much of the tab came from climate change.
Using a sea-level-rise mapping tool developed by Climate Central, the researchers could also show the areas that were inundated during Sandy that would have been spared in the absence of global warming. “There are areas that only flooded because of climate change,” Strauss says. That extra boost to water levels meant an additional 71,000 people and 36,000 homes were subject to flooding. Strauss says his team’s method can be used to calculate the damage costs of climate change for any past or future flooding event with sufficient sea-level data. Applying the new method, even to Sandy alone, gives a sense of the already steep cost of the climate emergency, he adds. “I think we’re paying a lot more than we realize,” Strauss says.
And the new study’s calculation is likely an underestimate, says University of Chicago economist Amir Jina, who investigates the financial impacts of climate change. The paper looked at physical damage, he says, so it did not include effects such as the interruption to business. Jina, who collaborates with one of the study’s co-authors but was not involved in this project, says having an estimate of the climate change cost helps put the price of reducing greenhouse gas emissions into perspective. “Anything that helps us understand the costs of climate change helps us understand how much we get by mitigating it,” he says.
Editor’s Note (7/16/21): A version of this article with the title “Climate Price Tag” was adapted for inclusion in the August 2021 issue of Scientific American. This text reflects that version, with the addition of some material that was abridged for print.
 Rights & Permissions