
Early one May morning in 1927 researcher Wilhelm Schmidt attached a mercury thermometer to his car door and drove around Vienna for three hours, recording temperatures. His resulting thermal maps showed hotter areas that coincided with “tightly built parts of the inner city” and cooler contours tracing wooded patches, grassy parks and waterways. Schmidt's efforts were the first to map a city's “islands” of heat in a “sea” of lower-temperature surroundings.
During Europe's 2003 heat wave, such islands were linked to approximately 50 percent of heat-related deaths in parts of England and to increased deaths among the elderly in Paris. The Environmental Protection Agency cites these zones as a prominent contributor to the 702 heat-related deaths reported in the U.S. on average each year from 2004 to 2018. More than half of the world's population now lives in cities, which exacerbate the local effects of rising global temperatures—and the suffering is getting worse.
University of Toulouse meteorology researcher Eva Marques and her colleagues are now updating Schmidt's car technique with modern methodology to chart dangerous heat zones. Their approach uses thermometers in Internet-connected personal cars to map how temperatures can vary over just a few city blocks; such data could help urban planners develop heat-mitigation policies in places without access to sophisticated instrumentation.
Urban heat islands occur when natural land cover is replaced with asphalt, concrete, steel, or other materials that absorb and retain more heat than their surroundings. This keeps these areas warmer, especially at night. Heat islands also affect a city's air quality by influencing humidity and how pollutants get distributed in the atmosphere. “With the increase of extreme events like heat waves, city planners need to rethink how urban spaces are designed,” Marques says.
Many cities lack weather station networks that can monitor heat islands comprehensively, so Marques and her colleagues took advantage of Internet-connected sensors that are increasingly becoming standard equipment in cars. First the researchers collected measurements from car temperature sensors in the French city of Toulouse, which has high-resolution weather stations for comparison, and examined how factors such as airflow affected the accuracy of the car-mounted thermometers. Next the scientists created temperature maps in several western European cities using a database comprising millions of car sensor measurements that manufacturers had collected for insurance purposes from 2016 to 2018.
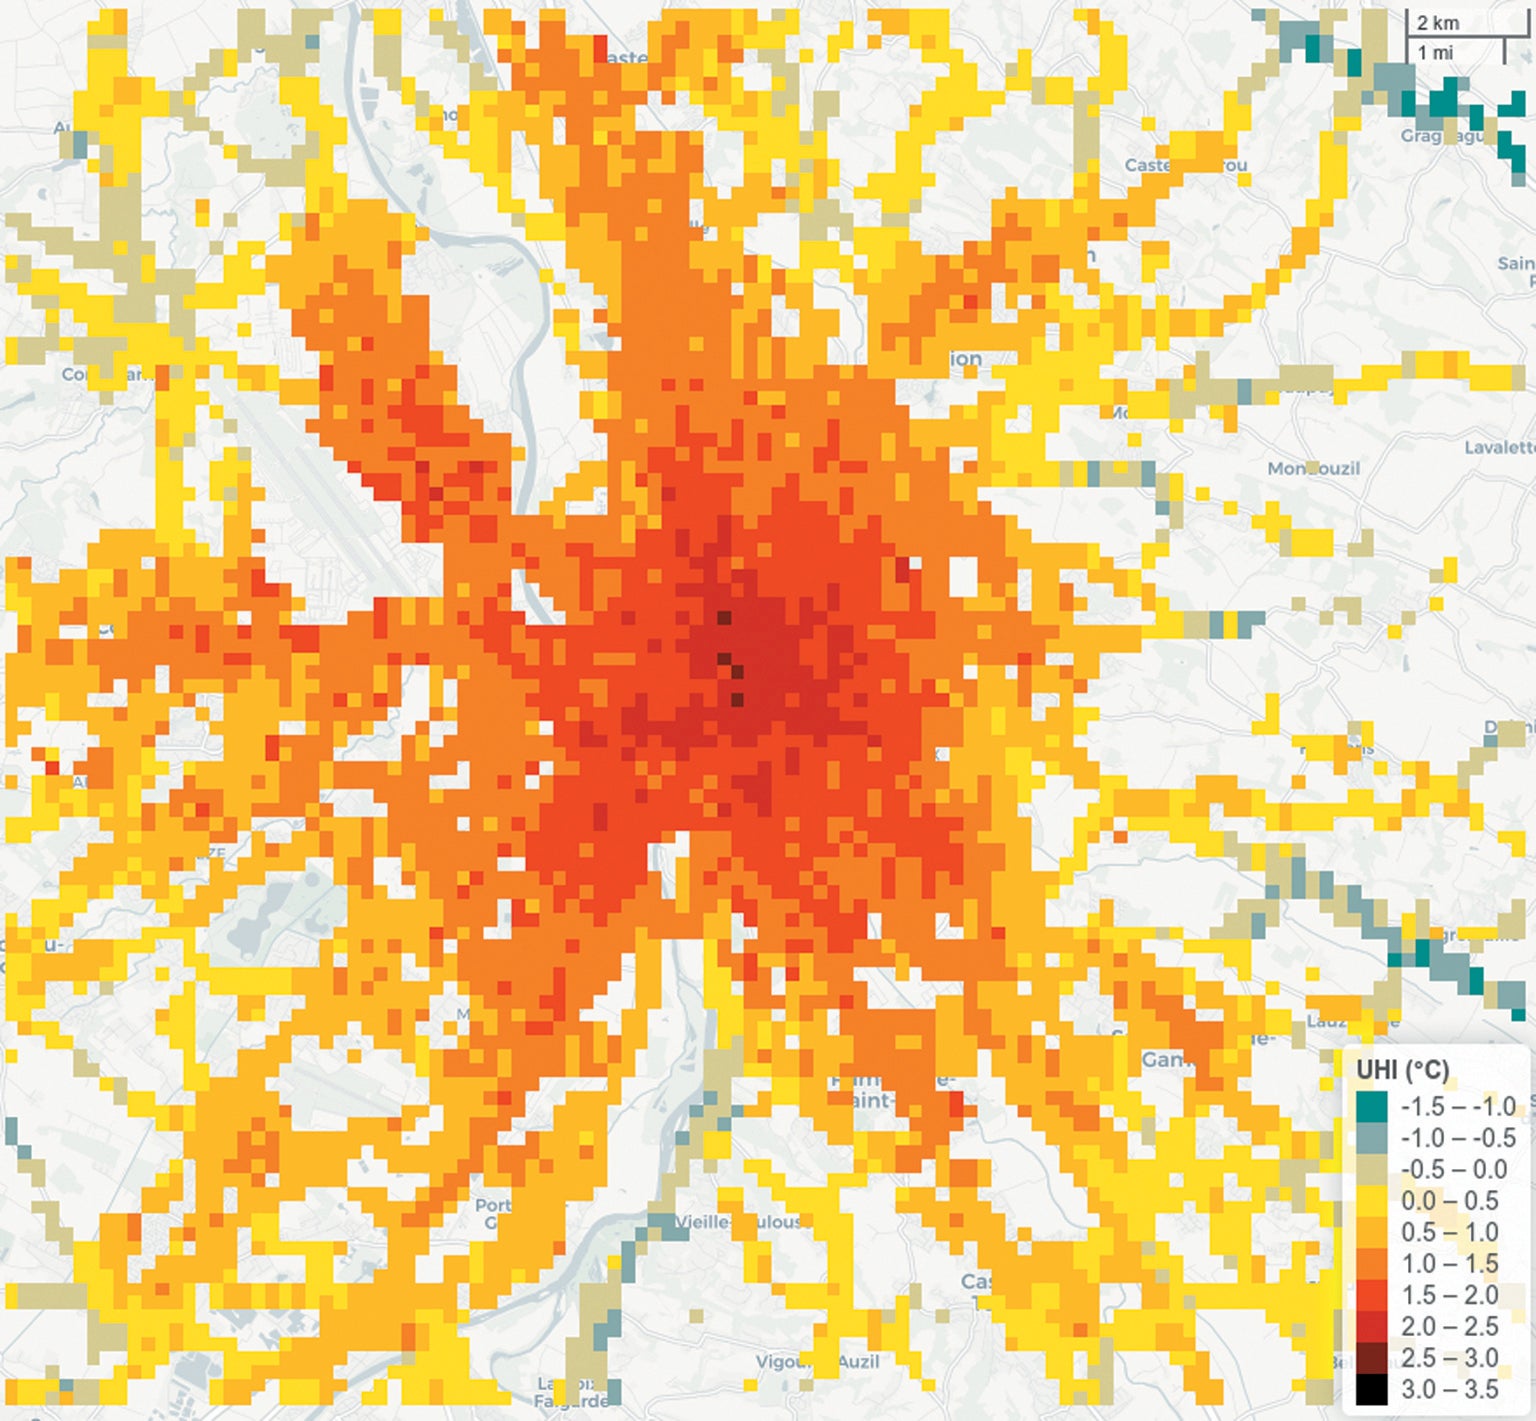
The researchers found they could reliably estimate temperature variations for spaces as small as 200 by 200 meters with fine-grained data collected at 10-second intervals. This method let them assess heat at the street level, where temperatures vary locally based on human activity, 3-D urban geometry and airflows. Their work was detailed in the Bulletin of the American Meteorological Society.
“Connected vehicle observations related to weather are an underused source of microscale observations,” says Amanda Siems-Anderson, a research scientist at the U.S. National Center for Atmospheric Research (NCAR), who was not involved in the study. “This work demonstrates a novel use for these data.” Iain Stewart, a researcher in urban climatology at the University of Toronto, who was also not involved in the study, adds that the work “is provocative and points to future possibilities for data retrieval in cities.”
Factory-installed sensors in vehicles can provide a wealth of weather- and climate-related data, Siems-Anderson says. The challenge is ensuring data consistency and quality, as well as building a robust infrastructure to pull those data from enough vehicles. For example, NCAR already collects vehicle data to supplement weather forecasts using a system that updates every five minutes. But such projects “often use 10 to several hundred [dedicated] vehicles, which do not provide adequate coverage unless they're in a very confined area,” Siems-Anderson says. Moving beyond pilot studies would require a dramatic scale-up. Additionally, quality control is crucial for opportunistic data sets gathered by cars that just happen to be in an area.
Authorities are working toward those capabilities. Local, state and national initiatives in the U.S. aim to install and operate infrastructure that can collect and process connected vehicle data and to improve the accuracy of community-driven urban climate research. The U.S. Department of Transportation, for instance, has deployed pilot programs in locations such as New York and Wyoming that monitor traffic and weather. Such data could eventually fill gaps between fixed weather stations for applications that include mapping and monitoring urban heat islands.
“Our maps could help researchers improve their understanding of how greenbelts, new buildings and bodies of water impact local thermal variations,” Marques says. Her goal is to make urban climate data available for policy-making processes. For example, her team collaborates with Toulouse municipal officials on making schoolyards greener and prioritizing neighborhoods for upgrades to cool buildings more efficiently—although they are not yet using her car-collected maps. And some small French cities that lack sophisticated weather station networks nonetheless want to use heat maps to assess urban conditions, Marques says. “Crowdsourcing data is a new hope to produce and share maps with these municipalities in the years to come,” she adds.
According to Stewart, it is difficult to create temperature maps of sufficient quality for city planning, and crowdsourcing the necessary data is in early stages. Maps would ideally also incorporate off-road places where people congregate. But eventually, Stewart says, “hot, crowded cities in lower-income regions of the world stand to benefit most” from crowdsourced thermal maps. Lower-income cities in tropical regions are historically understudied in urban climatology, and many still do not have access to the instruments that benefit other parts of the world—yet they are among the most vulnerable to urban heating.
More detailed maps of these cities could help planners design climate mitigation and adaptation strategies to address problematic spots within individual heat islands. “The advantage of developing this approach is that cars are everywhere,” Stewart says. “So you have the whole world at your fingertips.”
 Rights & Permissions